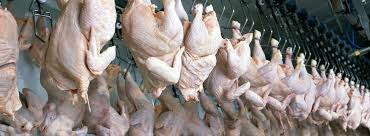
The chicken meat sample below was immersed in ozonated water for 30 minutes in 3 litres of tap water.
Both the foam and the meat ozonated were used for testing.
Ozone Effect of Ozone on Chicken Meat (Antibiotics Removal)
| Test Parameter | Unit | Results | |
| Foam | Chicken Meat | ||
| Chlortetracycline | mg/kg | Present | Absent |
| Oxy tetracycline | mg/kg | Present | Absent |
| Chloramphenicol | mg/kg | Absent | Absent |
The laboratory results showed that after ozonation, two of the antibiotics listed above were detected in the foam sample but not in the chicken meat. This suggests that the ozonation process extracted the antibiotics from the meat.
Heading (fixed):
Ozone Effect on Chicken Meat (Shelf Life Testing)
<td “width=”40”>Day 4
| Day | Total Bacterial Count at 37° C for 48 hours, cfu/g | |
Without Ozone Treatment | With Ozone Treatment | |
| Day 1 | 4 2.8×10 | 3 2.4×10 |
| Day 2 | 5 2.4×10 | 5 2.0×10 |
| Day 3 | 5 4.0×10 | 5 3.2×10 |
6 1.1×10 | 5 7.0×10 | |
The ozone treatment was conducted by soaking the chicken meat in 3 litres of deionised water for 30 minutes on day one only. Both chicken samples were then stored in a refrigerator at 4°C–8°C, and testing was carried out once daily.
The analysis results showed that bacterial counts were lower in the ozone-treated meat compared to the untreated sample.
Heading (fixed):
Ozone Effect on Chicken Meat (Nutrient Comparison)
| Test Parameter | Unit | Results per 100 grams | |
| A – Normal | B – Ozonated | ||
| Calories | kcal | 220 | 130 |
| Carbohydrates | g | 0 | 0 |
| Protein | g | 25.22 | 24.13 |
| Fat | g | 13.24 | 3.91 |
| Ash | g | 1.34 | 1.33 |
| Moisture | g | 60.12 | 70.60 |
| Fiber | g | 0 | 0 |
- Bothof the above samples submitted for proximate analysis were supplied by the client.
- The analysis results showed a significant reduction in calories and fat and a slight reduction in protein in the ozonated chicken submitted.
- The ozone treatment was carried out in 3 litres of tap water.
Ozone effect on Microbes ( Comparison)
Test Parameter | Unit | Deionised water, without ozone treatment | Deionised water *with ozone treatment | ||||
| – | – | 0 min | 30 min | Growth rate | 0 min | 30 min | Growth rate |
Total Bacterial Count @ 37° C for 48 hours | cfu/ml | 7 1.0×10 | 7 2.4×10 | +140% | 7 1.1×10 | 6 2.8×10 | -75% |
E.coli per g. (MPN) | cfu/ml | 6 6.2×10 | 6 8.4×10 | +35% | 6 5.4×10 | 6 1.6×10 | -70% |
Coliform per g. (MPN) | cfu/ml | 6 8.2×10 | 7 1.1×10 | +34% | 6 5.6×10 | 6 4.0×10 | -28% |
Salmonella in 25 ml | – | 4 8.0×10 | 5 1.1×10 | +38% | 4 8.5×10 | 4 7.0×10 | -18% |
|
The microbiological tests were conducted at 0 minutes and 30 minutes on the samples after the addition of cultured bacteria, to determine the growth rate in normal water and ozone-treated deionised water. The results showed a reduction in microbial activity in the ozone-treated deionised water compared to the untreated sample.
The ozone treatment was carried out in 3 litres of water for 30 minutes.
Ozone effect on Fish (Formaldehyde Removal)
A sample of “Kampung Fish” was sprayed with formaldehyde and left overnight. The sample was then divided into two portions and treated as follows for the analysis of formaldehyde residue:
- A) Un washed sample
- B)Soaked in tap water with ozone treatment for 30 minutes
On analysis of the Formaldehyde removal efficiency test, the following results were obtained:
A: Unwashed sample: 1000 mg/kg Formaldehyde
B: Ozonated sample: 0.53 mg/kg Formaldehyde
The ozone treatment was carried out in 3 litres of water for 30 minutes
Ozone effect on Vegetables ( Pesticide Removal )
A sample of the leafy vegetable “choy sum” was sprayed with lindane and profenofos, two commonly used pesticides. The sample was then left overnight, divided into two portions, and treated as follows for the analysis of pesticide residues:
- A) Unwashed
- B) Soaked in tap water with ozone treatment for 30 minutes
Gas Chromatography (GC), revealed the following:
Lindane mg/kg Profenofos mg/kg
Unwashed Sample 50 5000
Ozonated Sample 1.02 124
The results showed that both pesticide residues were reduced to low levels after ozone treatment.
The ozone treatment was carried out in 3 litres of tap water
Ozone effect on Vegetables (Freshness Comparison)
The “Pak Choy” samples were soaked in 3 litres of tap water and ozonated for 30 minutes.
From day 7 onward, the sample soaked in tap water began to shrink, whereas the ozone-treated sample remained in good condition.
Freshness Comparison
Normal and After ozone